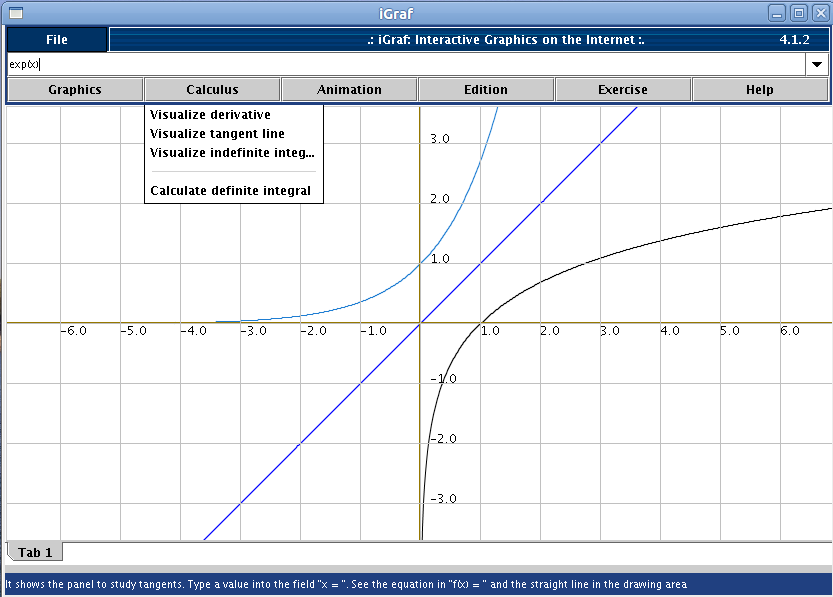
| Derivative Function Graphics | iGraf calculates and plot the derivative
graph of the function wich is in the edition (input) area. It is
unnecessary to draw the graphic of the original
function ... just type it and click Calculus
! Visualize Derivative. To see the math expression
of derivative, mouse over the curve. |
|
Figure 1 |
|
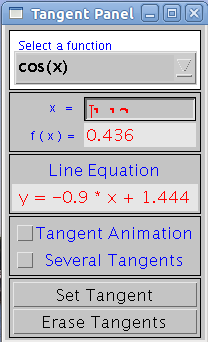
| Tangent Line | iGraf
allows users to see, interactively, the tangent line of a
curve at a fixed point. For each selected point in input field ‘x = ’, the user can
see a new math expression in the field ‘Line
Equation’ and the correponding graphic is plotted
on the drawing area.
If the user wishes to analyze more than one tangent line to
the same curve, in distincts points, just mark the
option ‘Several
Tangents’, select the tangency point of
your interest and click
‘Set Tangent’. |
|
Figure 2 |
| Indefinite Integral Graphics | iGraf calculates and plots the graphics of indefinite integral graph of the function wich is in the edition (input) area. It is unnecessary to draw the graphic of the original function ... just type it and click Calculus ! Visualize Indefinite Integral. It's not possible to visualize the math expression of indefinite integral, because the calculations are made numerically. |
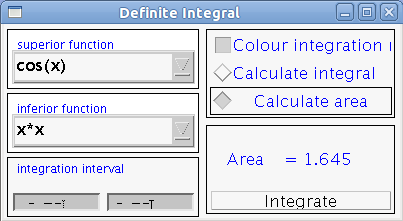
| Definite Integral | iGraf calculates definite integral and highlight, on screen, the integration region. After draw, at least, one graphic, click Cálculus ! Calculate Definite Integral to open the window below: |
|
Figure 3 |
|
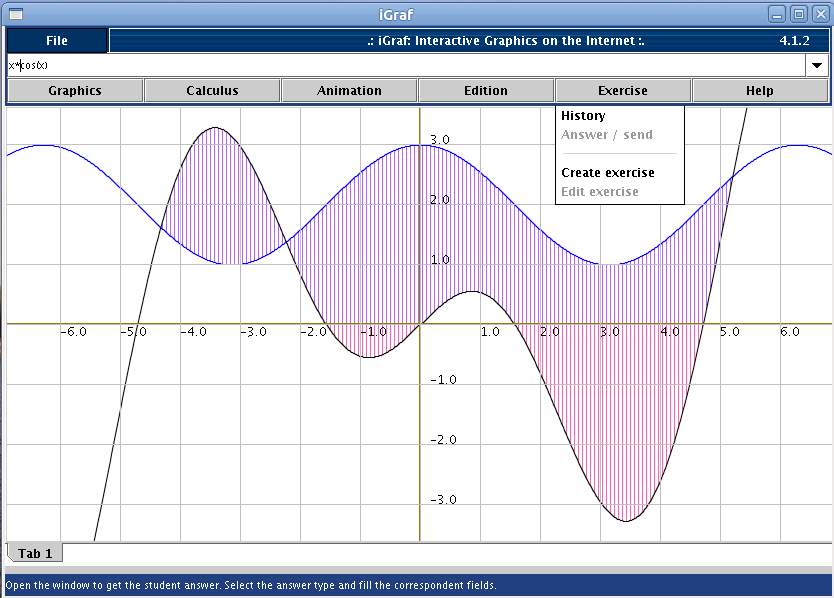
| Select the funtions that define vertical limites of the integration region (superior function and inferior function). Determine yet the values for the lateral limits for the integration region (integration interval) and click ‘Integrate’ option. To alternate among ‘Calculate área’ e ‘Calculate integral’ modes, check the desired option. The example below (figure 4) shows the integration region defined in the window depicted at figura 3. | |
|
Figure 4 |


