Graphical Interface
The iGraf is a tool to support teachers and students while
teaching and learning topics related to math functions, therefore its
use will be sporadic. It's necessary, therefore, to spent the minimum
the time to learn use the software. For this cause was
adopted a strategy to create a
minimalist graphical interface , allowing the user quickly
familiarize yourself with graphical elements consistently in such a
fashion that, after some time without using the software, the student
(or teacher) can quickly retake the use. Thus, the graphical interface
of the program was divided in
(just) four parts: editing area, drawing area, buttons menu e messages bar.
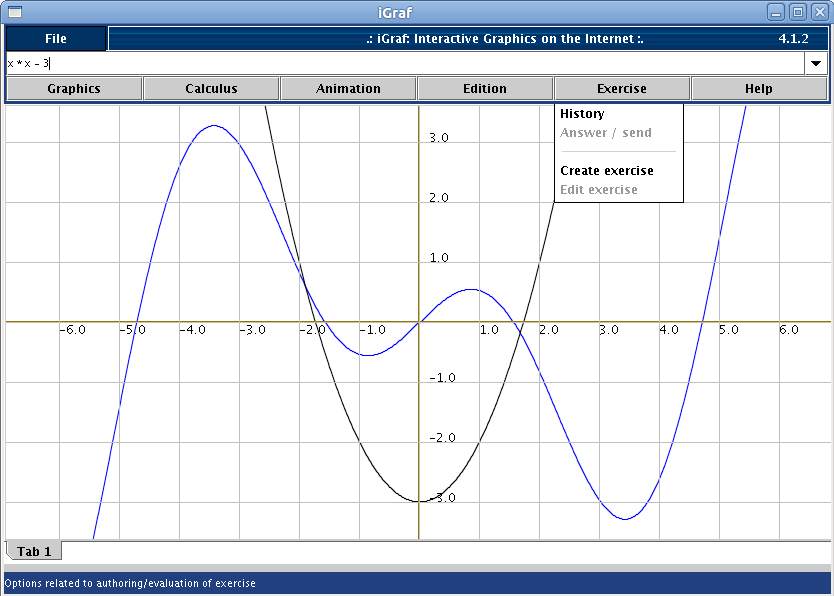
- Editing area
– this is the text field where the user could enter the expressions, to iGraf
draws its corresponding graphics into the drawing area.
With this area is under focus (when there is a blink cursor on it), it is
possible to use the arrows key in keyboard to get access to the expressions history.
- Drawing area –
this is area where the graphics are drawn.
With this area is under focus (when there is a blink cursor on it), it is
possible to move the entire area using the arrows key in keyboard.
The same is possible using the mouse, dragging the plane.
To get an automatic moviment, click <ALT> + <arrow key>, and any click over the drawing area stop this moviment.
To return to the original plane positioning, click the key <HOME>.
- Menu button –
this is a set of buttons, when clicked, they exibit their options. A click over each option will initiate its associated action.
- Message bar –
this is the most southern region of iGraf, whose target is to inform the user about options or the system status.