Function Graphic Plot
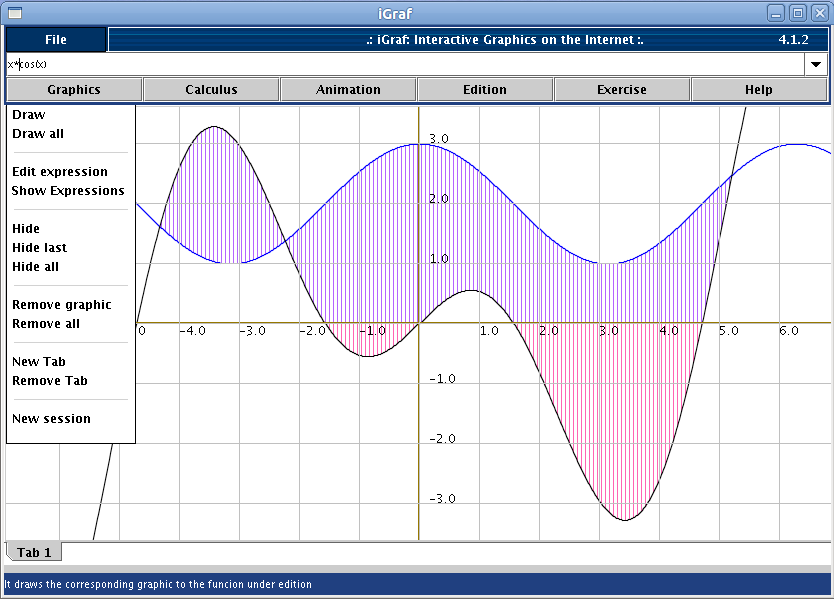
Static – iGraf draw cartesian function graphics from its equations. To visualize a parabola, the user must type in the input area the expression: x^2. In all cases mentioned below the graphic will be showed on the drawing area as soon as the user press ENTER key. Its possible to do the same thing by clicking Graphic ! Draw menu.
Dynamic – Its too possible the visualization of function graphics animations, to do it the user must insert an animation parameter in the math expression. Type an expression like a * cos (x) and see an animation.
Obs.: to move the cartesian plane, press left mouse button on the drawing area and drag the mouse; this allows the user to see parts of the graphic that are outside of the screen visible limits.
Domain Definition
Sintax– The user can define function domain to plot a graphic. It is done by adding, in the end of the math expression for the desired graphic, an ordered pair of real numbers between brackets separated by comma. E. g., x^3 – 4*x [-2.75, 3.8]
Obs.: the domain definition works in the same way to animations.
Polygon Drawing
Vertex – The vertex creation in iGraf is made using expressions like (a, b) , where a and b are real numbers, coordinates of some point at cartesian plane.
Polygon – A polygon is a vertex collection in brackets. A triangle can be determined as follow: [ (1, 2) (-2.2, 3) (5.43, -0.8) ]
Segment – In iGraf, a segment can be defined as a polygon with just two vertices.
Point - In iGraf, a point can be defined as a polygon with just one vertex.
On The Fly Graph Edition
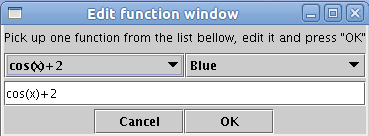
Graphics Manipulation – Using editing tool the user can alterate parts of expression that define some graphic in the drawing area. This functionality can be acessed from Graphic ! Expression Edit menu
To edit some expression, select it in the drop-down menu, making the expression be visible in the editing field. Click in this field and start edition. Its possible, during the edition process, change values of coeficients as well as insertion, alteration or remotion of function or animation domain; polygons can be edited in the same way.